
Nutritional statistics
The nutritional statistics as described in the article can be found in our WebApp.
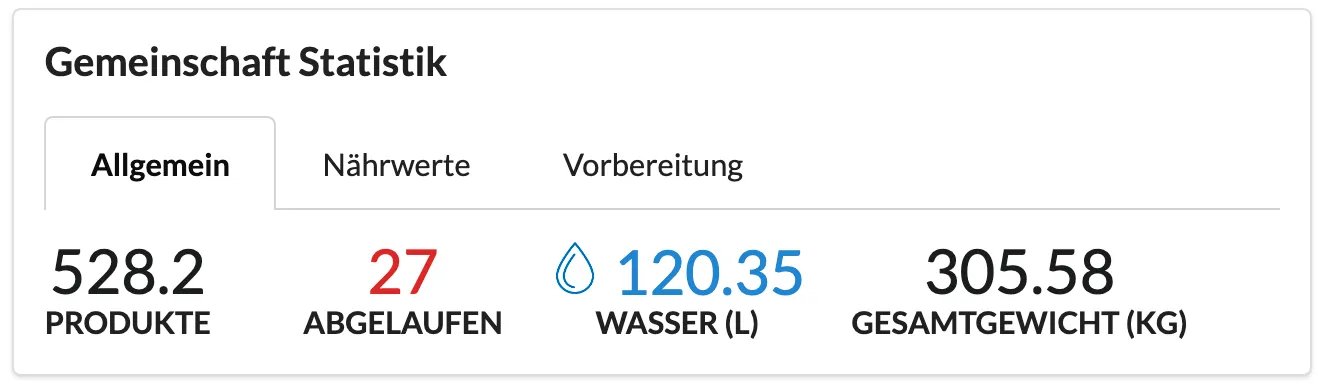
At the bottom of each storage location, you'll see general statistics. Here, you can see how many products are stored and how many are expiring/have expired. You'll also see the water content and the total weight. In the community, you'll see the overall statistics for all storage locations.
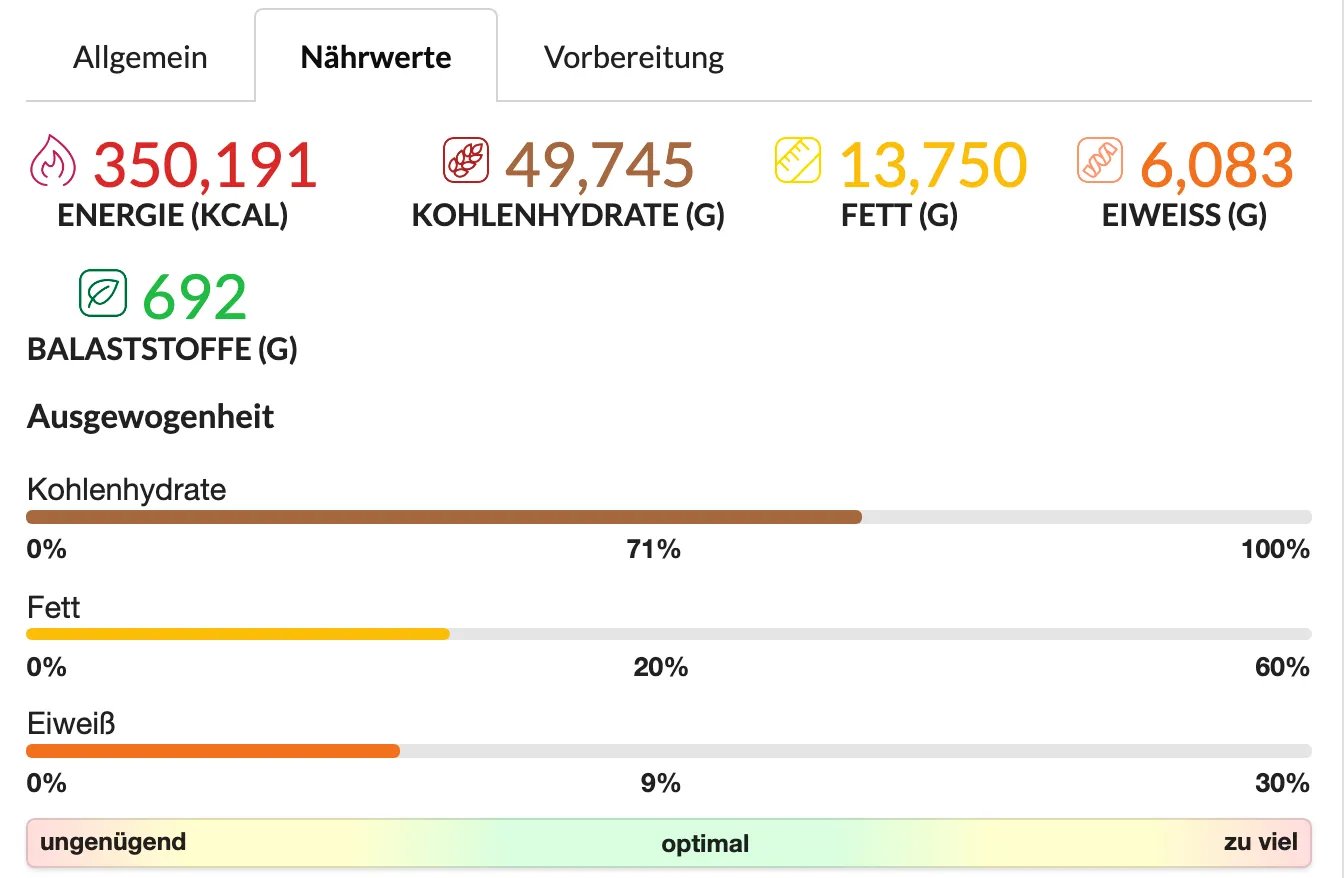
In the second tab you can see the total energy content of all foods (in kilocalories), as well as the pure amount of carbohydrates, fats, proteins and fiber in grams.
For a balanced diet, 55% carbohydrates, 30% fat, and 15% protein are recommended. If this optimum is achieved through the storage, all three bars are in the green middle range. Deviations occur in the yellow or red range. In this example, the carbohydrate content of the storage is too high, while fat and protein are underrepresented. For an optimally balanced storage, products containing fat and protein should also be stored.
Please also check out the preparation mode if you want to know how long your supplies will last: How does the preparation stats work?